“Cognitive tools are premised on the idea that humans learn more from constructing and justifying their own models of systems than from studying someone else’s.”
Jonassen, D. H. (2003). Using Cognitive Tools to Represent Problems. Journal of Research on Technology in Education, 35(3), p. 372.
What are they?
Allele offers a suite of tools specifically designed to help students improve their ability to identify and solve diagnostic problems. Allele’s clinical reasoning tools have roots tracing back to the early 2000s, have been deployed in the classroom with great success, and have been iterated and improved upon in the decades since, both in terms of design and technology. Combining the basic blocks with these more specialized tools, we can create cases in Allele that simulate real cases for medical students in training or courses like clinical pathology. Let’s take a closer look at these tools and how they can work together to build a case in Allele.
Tools
Observation List
The observation list is a shared tool that is present in all student phases. The observation list is displayed in a pane on the right that can be opened or closed. Students can highlight text in a phase to create an observation or freely add one by typing into the input field in the observation list. Observations persist through phases within a case.
Lab Chart
The lab chart block is a specific type of interactive table that can be used to simulate a laboratory data sheet you might find in a clinical setting. Each cell within a table block can be another block, and that’s true for the lab chart as well. A typical lab chart has 6 columns: test name, result, units, normal range, analysis, and abnormality name, with the first 4 being paper blocks, and the analysis and abnormality columns using new types of blocks: lab analysis and lab abnormality respectively. Students work through each row of the lab chart, analyzing the results of each test and identifying the abnormality (if there is one).
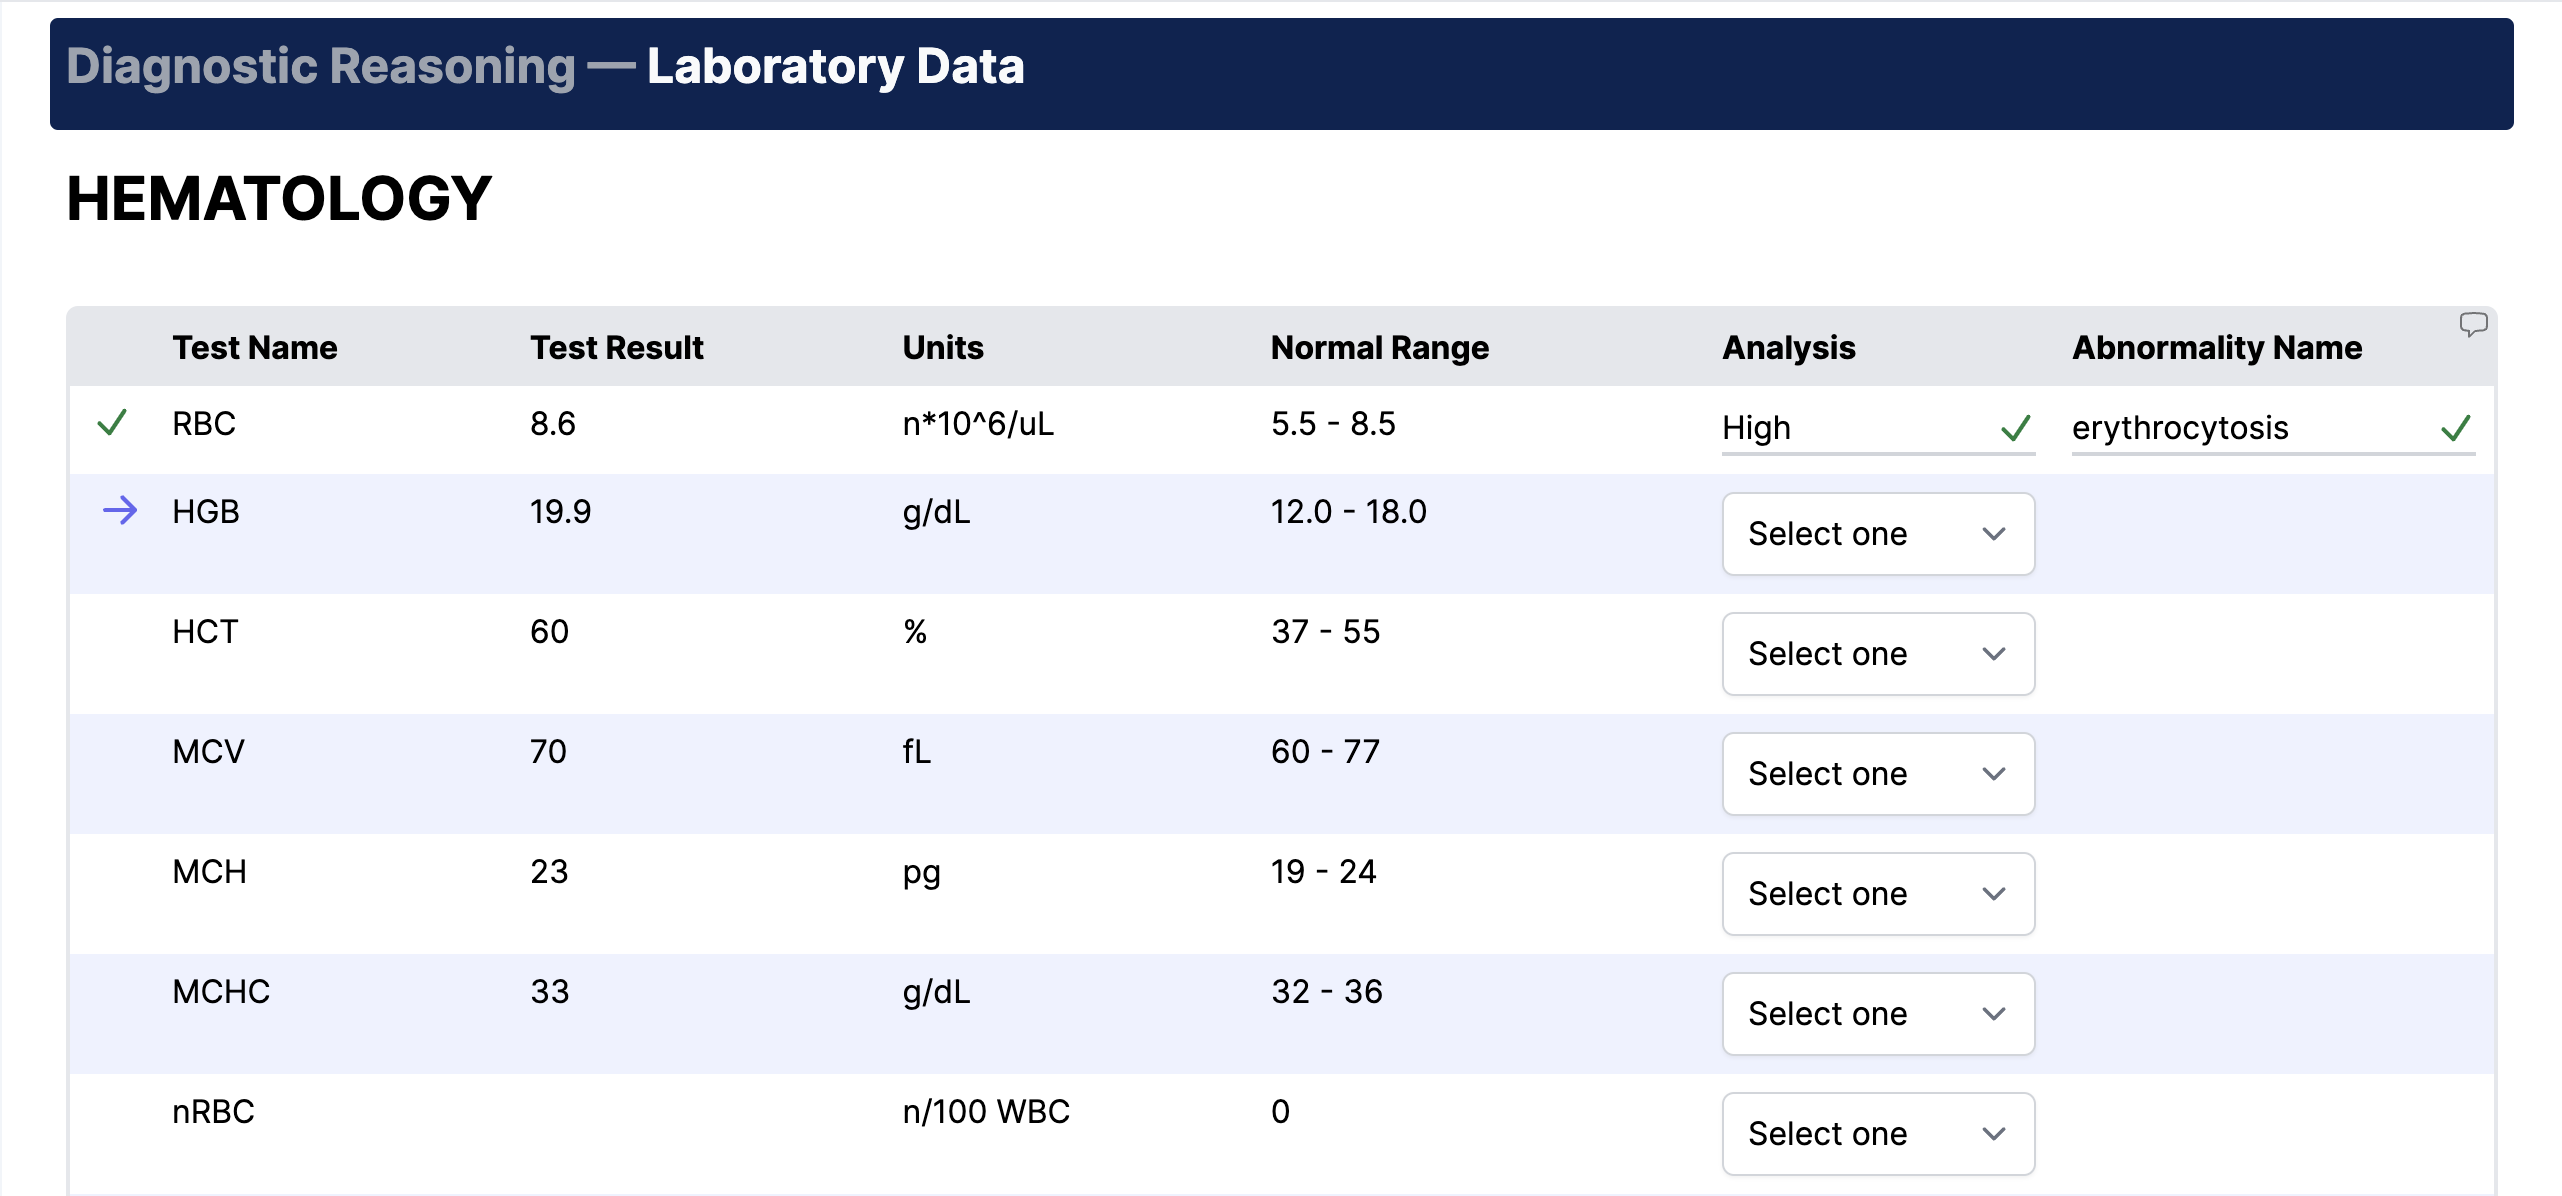
Lab Analysis
The lab analysis block in a lab chart is a customizable select component. You can modify the selectable options, for example, Low, Normal, and High, and also set the correct analysis option. When students use a lab analysis block, they are able to select options until they select the correct answer. The lab analysis block works in conjunction with the lab abnormality block on the same row, revealing the lab abnormality block once the student has selected the correct analysis (if the test is indeed abnormal).
Lab Abnormality
The lab abnormality block need only be present in a lab chart row if the test result is abnormal. The lab abnormality block is a small input field that allows the student to enter the name of the abnormality. You will set the correct abnormality name, as well as the number of attempts they can make before the name is revealed to them (by default, 3). If they exceed the maximum number of attempts, the name is revealed to them and they must type it into the input field to proceed. Once completed, the lab abnormality block will automatically add a new observation of type “Data” to the observation list for the student or team. Lab abnormalities that are the same name as previous abnormalities in the same table will be autofilled by the system when the student selects the correct analysis.
Lab Correctable
The lab correctable block is less commonly used in the lab chart and is typically for correctable values like reticulocyte counts. A lab correctable block is a selectable ‘Yes’ or ‘No’ option in response to “Should this test be corrected?”, followed by an input field if ‘Yes’ is selected. The student then enters the corrected value. You can set the correct response (‘Yes’ or ‘No’), the correct value if ‘Yes’, and similar to the lab abnormality, a max number of attempts a student makes until a hint can be revealed (by default 3). The hint is also customizable, but often used to show students the formula to calculate corrected reticulocyte counts.
Diagnostic Path
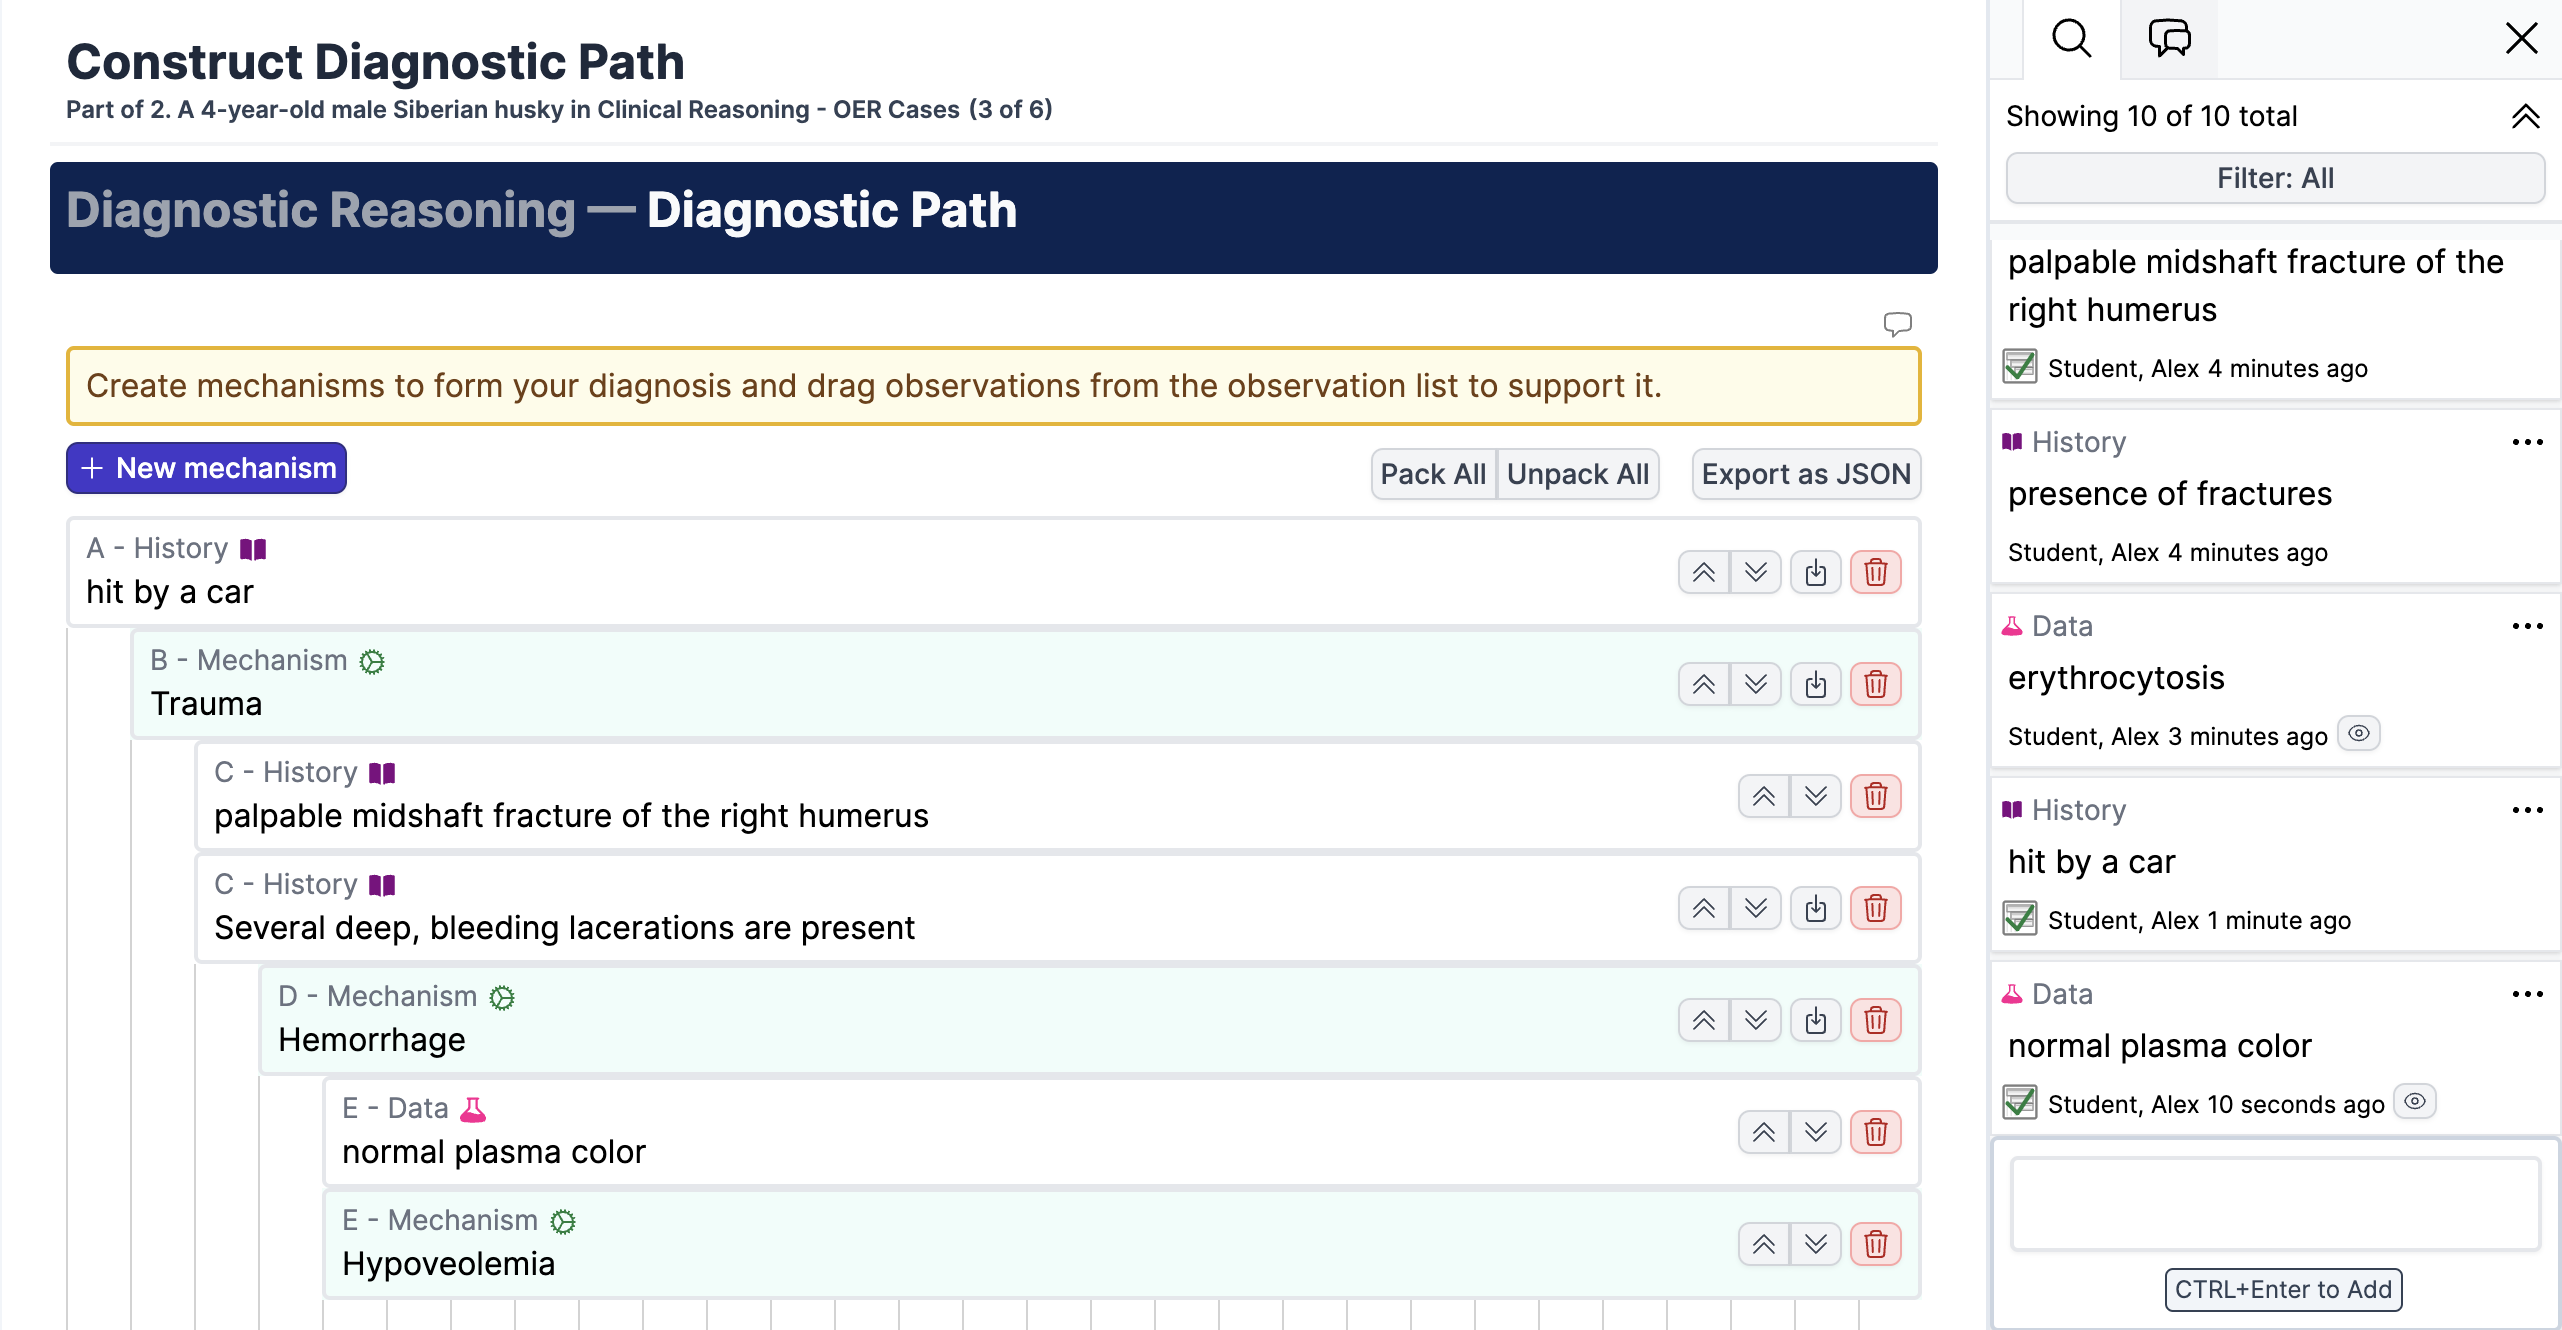
In concept, the diagnostic path displays the students’ diagnostic reasoning in an outline form of propositions that relate patient observations and laboratory data to the corresponding disease or physiologic processes occurring in the patient. The diagnostic path block is a hierarchical input area that allows students to organize observations taken from earlier phases in a case into a structured list. Students are able to create mechanisms within the path and drag observations from the observation list to support those mechanisms to form a diagnostic pathway.
Expert Path
After entering a diagnosis, you can reveal to students an expert’s diagnostic path to see the rationale used to form the diagnosis. Using a carry forward block, students are able to compare their completed diagnostic path side-by-side with an expert’s diagnostic path. To see how to do this in Allele, check out our how-to guide on configuring expert paths.
How does it all fit together?
Putting all these tools together, we can make a case in Allele that facilitates clinical problem solving, starting with low-order thinking tasks, like observing patient history and identifying and naming data abnormalities, then proceeding to higher-order thinking where students identify pathophysiologic mechanisms and form diagnostic conclusions supported by their own observations. The case concludes with a comparison with an expert’s thought process and self-reflection. The phases in such a case might look like this:
- History & physical examination
- Laboratory data
- Diagnostic path
- Diagnosis
- Expert path
- Self-assessment
History & physical examination phase
Using basic paper blocks, we can add patient history, physical examination notes, and images of the patient. We expect the student to take observations from this phase by highlighting diagnostically relevant bits of texts.
Laboratory data phase
In this phase, with one or more lab chart blocks, we can replicate laboratory data sheets that one might encounter in a clinical setting. The interactivity of the lab chart ensures that students analyze each test result, determine if they are normal or abnormal, and any abnormalities they enter will be automatically added as an observation to the observation list.
Diagnostic path phase
To allow students to use those observations they’ve taken from phases 1 and 2 to form a diagnostic pathway, we can add a diagnostic path block to this phase. You can configure the instructions for a diagnostic path as well as add any path items that you’d like the students to have pre-populated when they get to the phase. If you’d like to set an expert path to be used in a later phase, this is where you would do that. See our how-to guide on configuring an expert diagnostic path.
Diagnosis phase
The students have used their observations to form a diagnostic pathway, but we might ask them to commit to a diagnosis by adding a short-form response block to this phase.
Expert path phase
Now that the students have committed to a diagnosis, we can reveal the expert’s pathway, diagnosis, and rationale. Use a carry-forward block to carry forward the diagnostic path response from the diagnostic path phase and display it here. When used with a diagnostic path, the carry-forward block renders the student path side-by-side with the expert path. You may also want to lock this phase by default, ensuring that they’ve committed to a diagnosis before viewing the expert’s response.
Self-assessment
Finally, you may choose to offer the student a self-reflection, either using a long-form response block or a multiple-choice block gauging how close they think their path was to the expert’s.
FAQ
Can the clinical reasoning tools be used in team phases?
Yes.
Can I pre-populated the students’ diagnostic path?
Yes. By using the “New Mechanism” button in a diagnostic path block, you can create new path items, change their type, and edit the text by double-clicking them.