What is it?
A lab chart block is a phase authoring component that allows the creator to insert a specialized table that can be used to display laboratory data, and allow learners to interact with the data in a variety of ways.
Typically, students will look through different lab tests, analyze the results, and identify any abnormalities.
Each cell in a lab chart can be populated with lab chart-specific blocks.
- Lab Abnormality
- Allows students to enter an abnormality name. Authors can customize the inputs required (“Erythrocytosis”, “Anemia”, etc.), including multiple correct responses if there are acceptable synonyms. Additionally, authors can configure how many incorrect attempts students can input before displaying the correct answer.
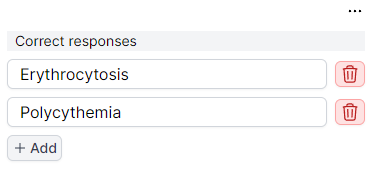
- If the student reaches the maximum attempts and is shown the correct answer, they are still required to type it in the Lab Abnormality input box.
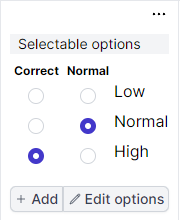
- Lab Analysis
- Allows students to select from any number of analysis options. These options often are in reference to the test result and whether it is “Low”, “Normal”, or “High” based on the expected range. However, these options can be configured to any text value.
- The author can also select a “Correct” answer. This forces the student to get the selection correct before proceeding.
Did You Know?
The lab chart is often used as part of cases designed to support clinical reasoning in the classroom. Often, students are presented with a case that has patient history and physical examination results, lab data and culminates with a diagnostic path to bring all of their findings into a structured diagnosis.